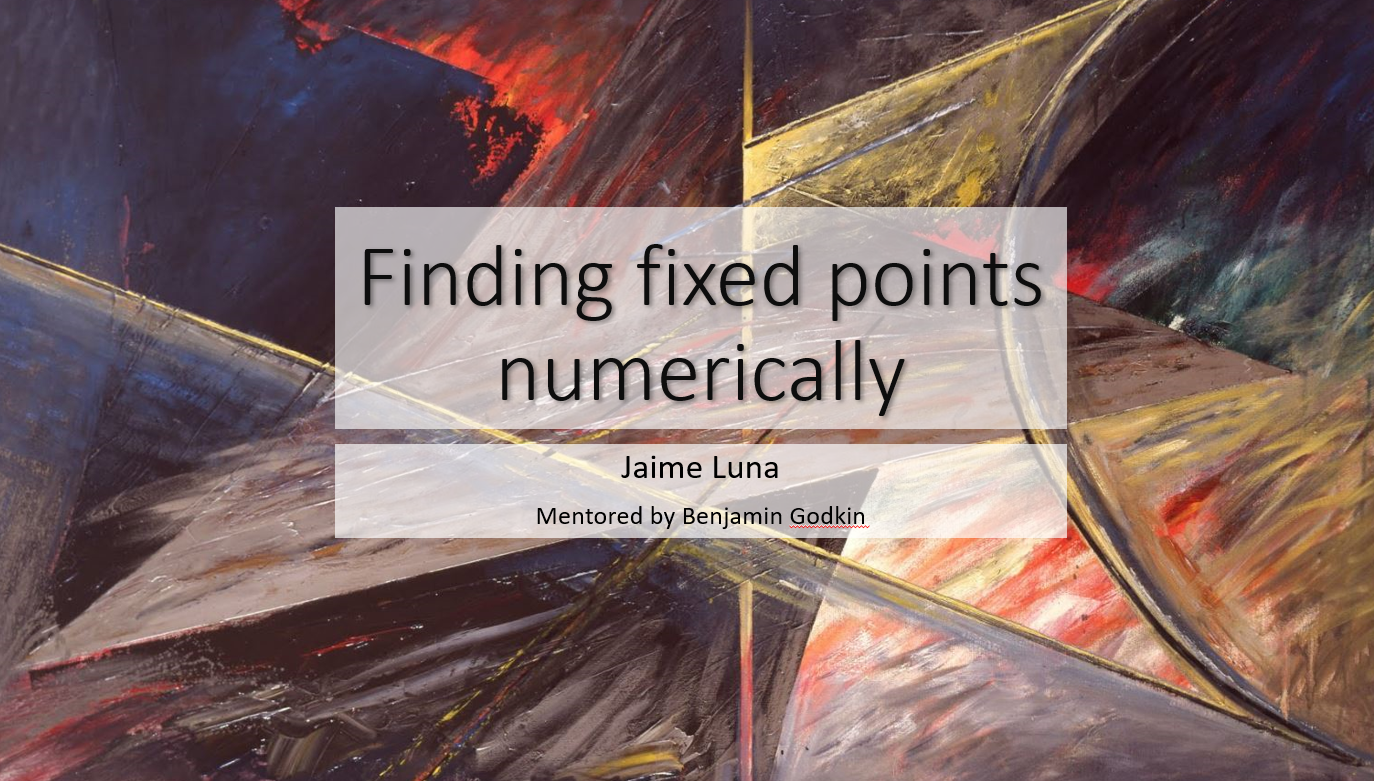
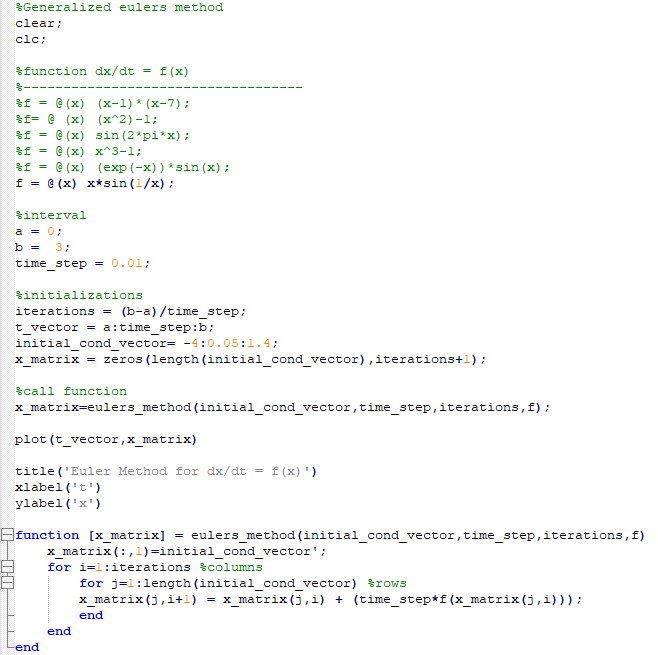
As part of a suplemental reading program in the Mathematics Department of UC Davis,
I had weekly meetings with a graduate student mentor to discuss topics
from selected readings in the chosen field of Dynamical Systems. The main text for this
independent study being "Nonlinear Dynamics and Chaos" by Steven H. Strogatz.
I supplemented the readings with programming in MATLAB to illustrate
the advantages of computing to gain insights into the behavior of nonlinear systems of equations that
are impossible to solve analytically.
An important recourse, as most real world phenomena can only be written mathematically as nonlinear systems.
The particluar method I used was Euler's Method (featured in the film, "Hidden Figures").
Below are PowerPoint slides I presented to other participants, mentors, and organizers
at the end of the term.
MATLAB code used to generate plots:
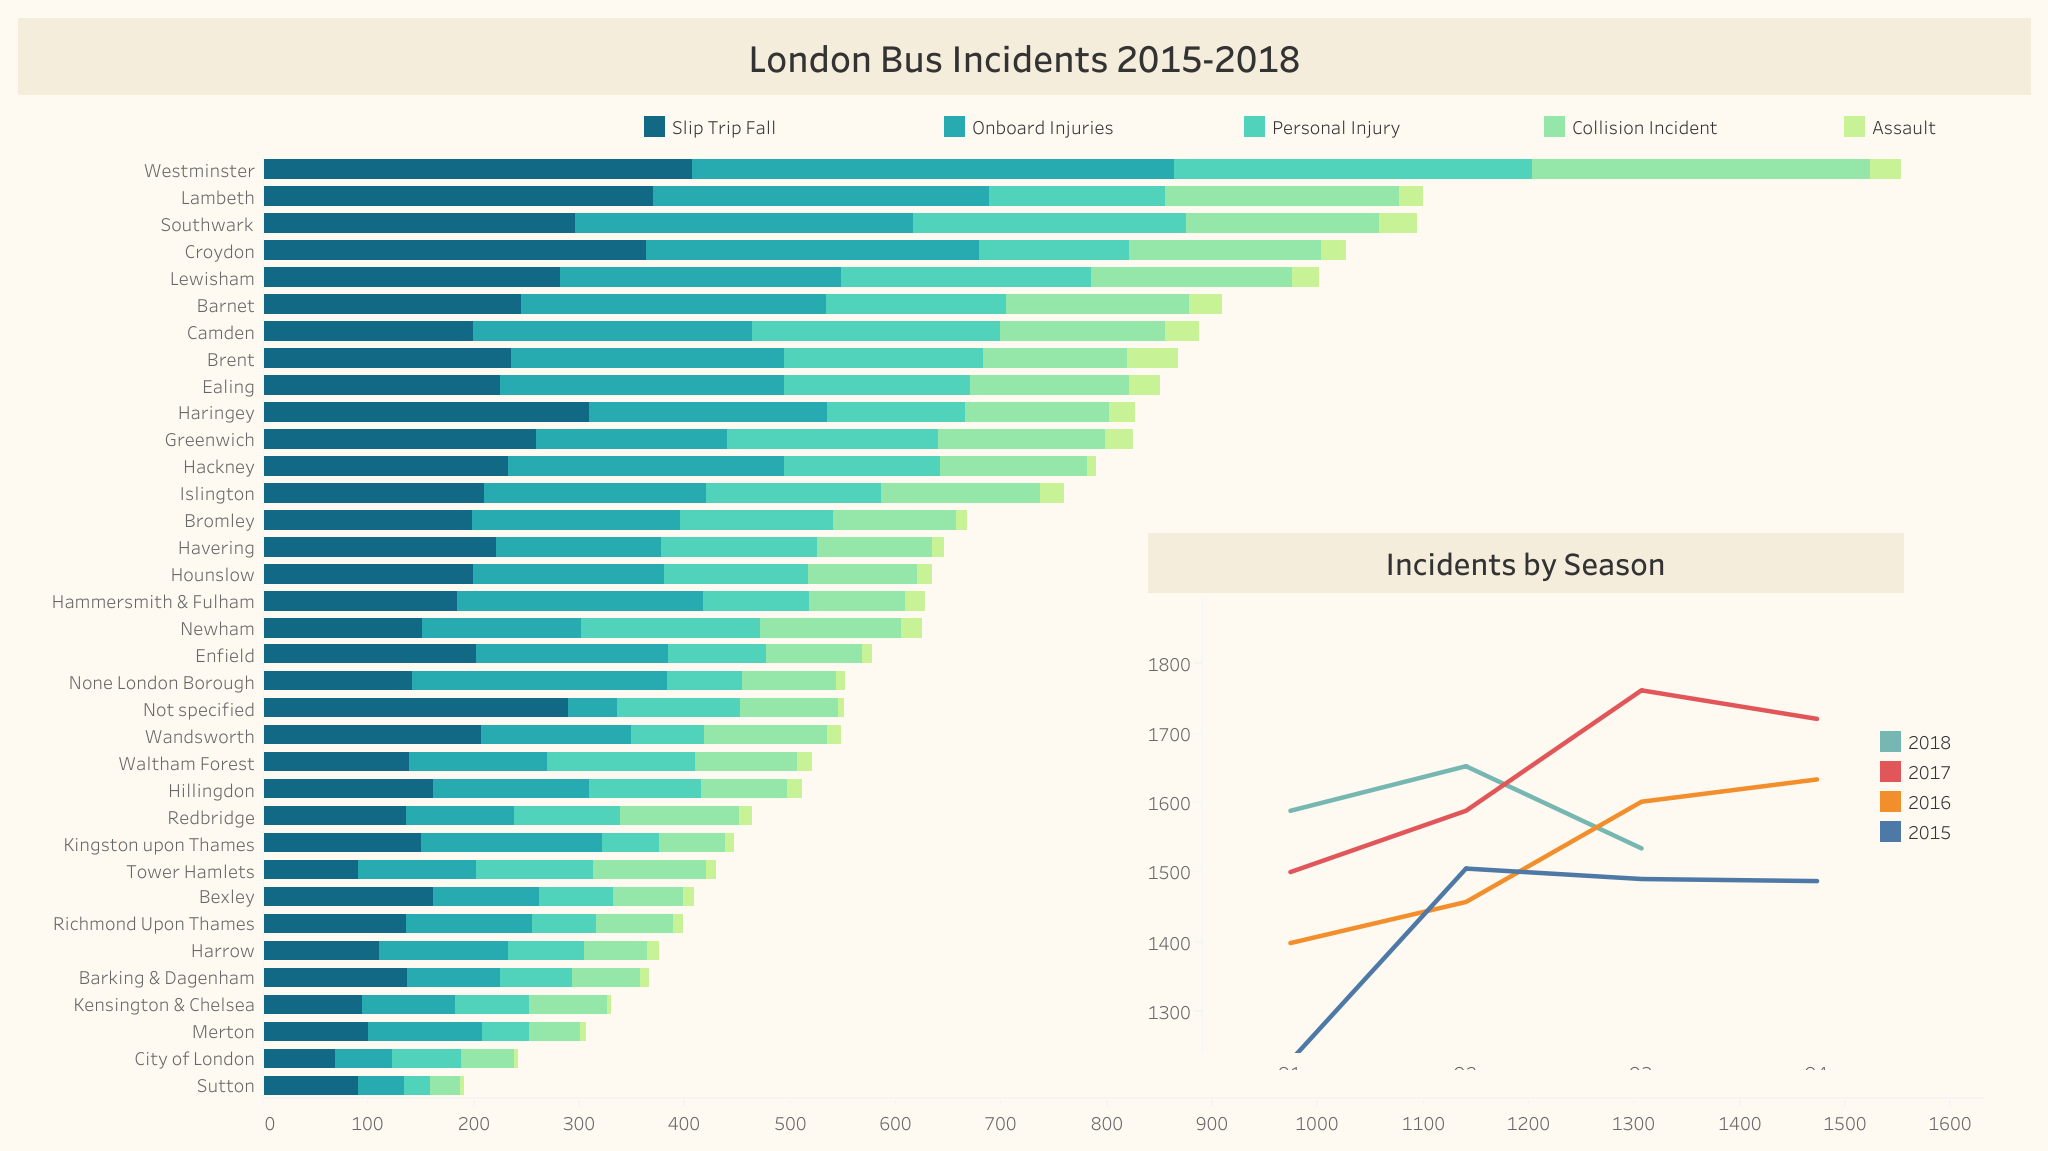
I created this stacked bar chart and time series line graph for London bus incidents
as part of Coursera's Data Visualization course.
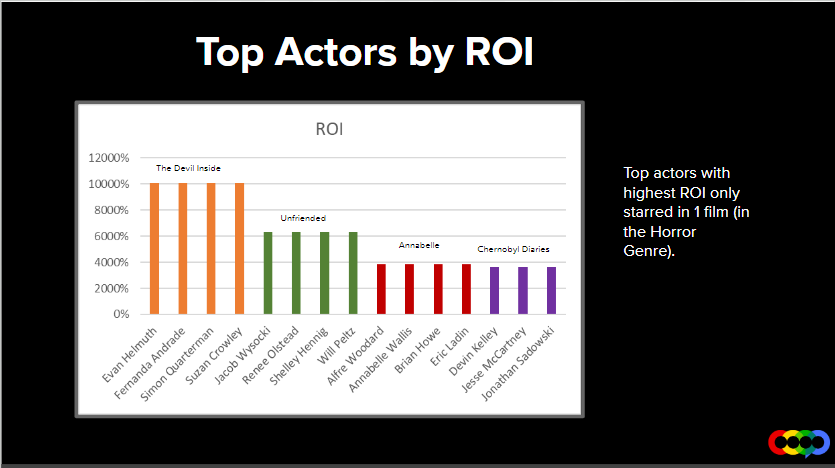
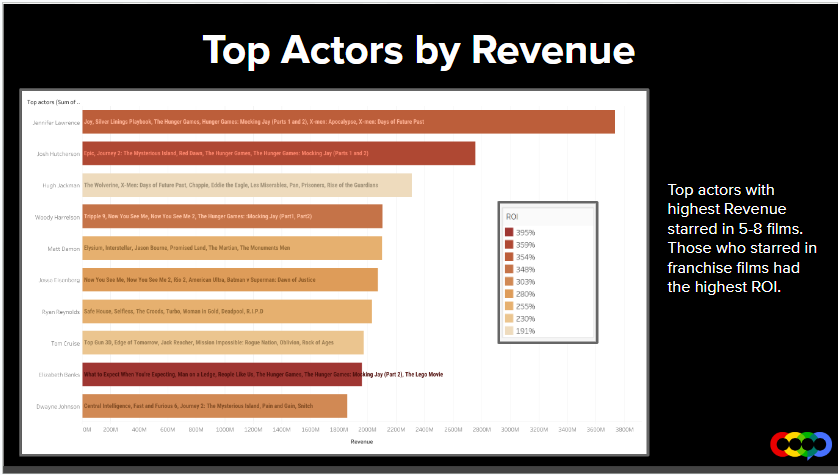
Film Investment Project
This a mock project using a dataset of films from 2012-2016
as part of a group project in a Data Analytics Apprenticeship
with CO-OP Careers, a professional development program.
Included are select slides that I created and presented as an analysis of
actor performance.